Description
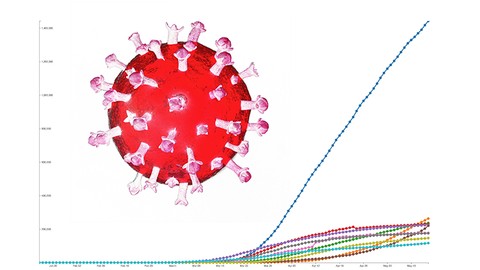
This project takes you through building a data visualization of COVID19 data from Johns Hopkins University from start to finish, using HTML, CSS, JavaScript, and D3.js. In this project, you'll learn how to process data to pull out relevant information, structure the data for visualizing, use JavaScript's map and filter methods, use D3.js's scale functions, and more. You'll practice your JavaScript skills while creating a visualization to help you and others understand real world data affecting everyone right now.
Who this course is for:
- Beginner to intermediate JavaScript programmers
- Programmers who want to learn D3
- Programmers who are curious about visualizing data
