
ciboga submitted a new resource:
Process Time Series Data with JavaScript - Create a data visualization with JavaScript and D3.js
Read more about this resource...
Process Time Series Data with JavaScript - Create a data visualization with JavaScript and D3.js
Description
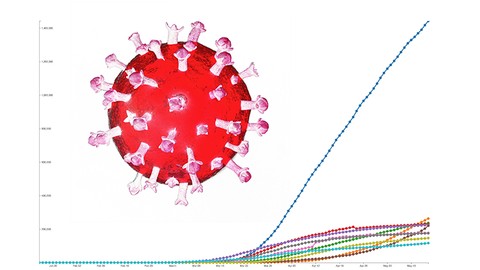
This project takes you through building a data visualization of COVID19 data from Johns Hopkins University from start to finish, using HTML, CSS, JavaScript, and D3.js. In this project, you'll learn how to process data to pull out relevant information, structure the data for visualizing, use JavaScript's map and filter methods, use D3.js's scale functions, and more. You'll practice your...
Read more about this resource...

![[Ebook] Largeapps Dev - Building Large Scale Web Apps | A React Field Guide](https://i.imgur.com/CKxZPRy.png)

